The drop in oil prices had a significant impact on the Canadian economy during the past year. The outlook for this sector, which represented 6.5% of the gross domestic product in 2015, has deteriorated significantly. The persistence of low prices resulted in a sharp decrease in business capital spending and the disappearance of tens of thousands of jobs in the oil-producing provinces. Voters have shown their discontent in recent elections by ousting the conservative governments in Alberta and in the Canadian federal Parliament.
Canada’s 1.2% GDP growth in 2015 was well below the 2.1% rate estimated in the federal Conservative government’s April 2015 budget. Our 2016 growth forecast for the Canadian economy as a whole is 1.8%, which is slightly higher than the Bank of Canada’s 1.7% forecast published in last April’s Monetary Policy Report. Moreover, the repercussions of the forest fires on Alberta’s oil production will likely require a slight downward revision to these forecasts.

Insightful research: the key to our expertise
Overview of Provincial Budgets
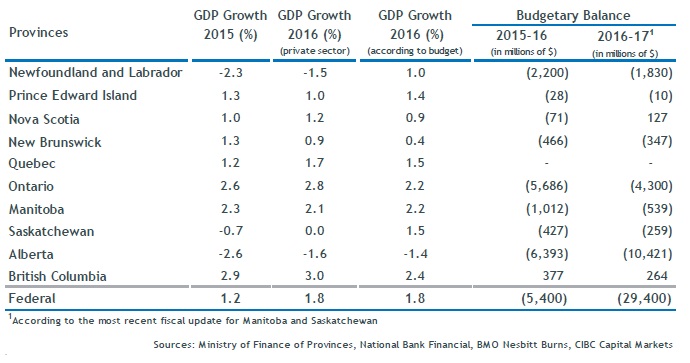
A reading of the provincial budget documents reveals that growth estimates vary significantly from one province to the other. Economic growth forecasts for Alberta and Newfoundland and Labrador, whose economic activity is heavily reliant on oil production, are the most pessimistic. According to forecasts, the 2016-17 fiscal year will show a second consecutive yearly decline in growth. These provinces’ budgets posted disastrous results for the fiscal year ended last March and regrettably, they will be just as bad in 2016-17. Moreover, the Fort McMurray forest fires will unfortunately lead to an increase in this fiscal year’s deficit in Alberta.
Efforts to reduce expenditures in Quebec, British Columbia and Nova Scotia have paid off. A return to a surplus position for fiscal 2016-17 is expected for the first two provinces and, as stated in last year’s budget documents, the Nova Scotia government expects to bring the books into balance this year and to post surpluses in the following years – an enviable position for the Maritime province.
Ontario’s fiscal 2016-17 budget should be written in red ink for the last time. The province will post a longawaited surplus in 2017-18, its first since the 2008-09 fiscal year. It is not unlikely that results could be better than expected in light of the government’s rather conservative growth forecasts and the set-up of a contingency fund. Additionally, the province will remain in the lead in terms of this year’s GDP growth rate.
Manitoba and Saskatchewan had not tabled their budgets at the time of writing. The arrival of the new government in Manitoba last April 19th points to the likelihood that it will announce bleaker results than previously expected and that reaching a balanced budget will be postponed. In its financial update last March, the previous government took the opportunity to state that the deficit estimate for fiscal 2015-16 will be higher than forecast and postponed the return to a balanced budget for yet another year or until fiscal 2019-20.
Expected Date of Return to Balanced Budget
Following the recent provincial elections, Saskatchewan voters were the only ones not to “vote for change”. The government of Premier Brad Wall, the leader of the Saskatchewan Party, a conservative political party, remained in power and will table its budget forecast on June 1st. The drop in oil prices was responsible for the interruption of the succession of budget surpluses in the 2015-16 and 2016-17 fiscal years. It remains to be seen what the government’s expectations are for growth in the other sectors of the economy.
Despite tax hikes and spending cuts, New Brunswick has once again pushed back the date when it will achieve a balanced budget. Although the provincial government’s growth forecasts are on the cautious side, the impacts of demographic changes have to be dealt with, and the government will have to find ways to increase own-source revenues.
The Federal Budget and its Impact on the Provincial Budgets
Since coming into office, Justin Trudeau’s government had to face very different financial results than those forecast in the previous government’s budget. To stimulate growth, the new federal government’s budget increased spending leading to sizeable deficits. If the government forecasts are correct, we will not see a balanced budget before the next decade. Despite the government’s cautious use of its significant contingency funds, the budget did not specify an expected date for a balanced budget – a timeframe that goes beyond the 2020-21 fiscal year.
With its AAA credit rating, Canada’s position gives it a fair deal of flexibility, especially when one considers its debt ratios compared to those of other countries with the same credit rating. Despite deficits that will exceed $100 billion over the next five years, Canada’s debt ratio will reach a maximum of 32.5% of GDP at the end of the period.
Provincial governments are conscious of the federal government’s good financial health. Within this context, some provincial governments, namely Alberta and Newfoundland and Labrador, are hopeful that the central government will inject funds into these provinces. Although the Bank of Canada was ready to further stimulate the economy, it was anticipating that a considerable effort on the budgetary front would be made by the new federal government. In addition to the infrastructure programs that will be specified in the next fiscal years, the federal government instituted different measures that will benefit the middle class and hence, contribute 0.5% to GDP growth in 2016-17 and 1.0% in 2017-18. The provinces have high expectations that transfer payments in health and social programs will be renegotiated higher.
The Impact of Falling Oil Prices on Equalization
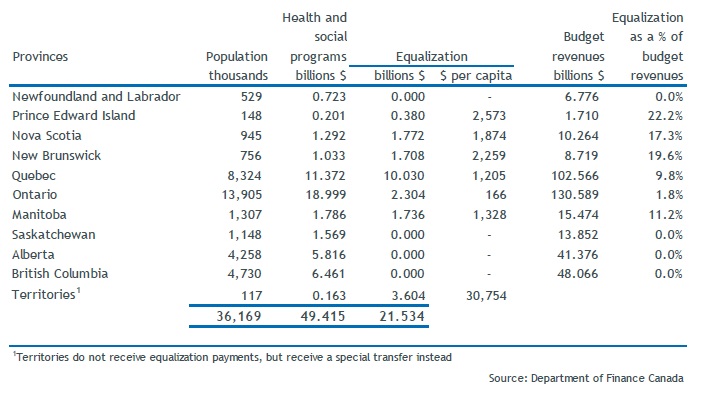
Within the Canadian federation, the federal government redistributes to the provinces part of the revenues it generates through income taxes levied on Canadians from all provinces. In cases where the costs of the programmes are shared (health and social assistance programmes), the amount of the transfer is established on a per capita basis across the country. Hence all Canadians, wherever they reside in the country, benefit from these transfers. On the other hand, equalization is a programme that redistributes the wealth on a regional basis.
From the income taxes generated nationally, the federal government redistributes a global amount to the provinces whose capacity to raise taxes and royalties is lower than a national standard defined in the equalization programme. Provinces whose fiscal capacity is less than the national standard receive equalization payments while the provinces whose fiscal capacity is above the standard do not receive any payments. The amount received by each province is determined on a per capita basis and varies according to the province’s specific fiscal capacity relative to the national standard.
Federal Support to the Provinces and Territories
Since 2008, the annual increase in the global amount of equalization payments has been capped at the nominal growth rate of the economy. Within the framework of each province’s budget forecasts, the increase in the amount of the payments is generally estimated without much error.
It is however more difficult to assess the amount of equalization payments that a province will receive. We have already mentioned that this amount depends on the gap between a province’s fiscal capacity and the national standard. Without going into the details of the calculations that determine these two parameters, let us mention that the most volatile elements of the revenue stream – more specifically, the royalties related to natural resources which are subject to the highest short term fluctuations – can cause these amounts to vary. Let us also mention that a big relative increase in unemployment in a given province has a significant impact on its fiscal capacity.
To avoid abrupt changes, the formula includes a smoothing mechanism whereby payments in a given year are based on the average fiscal capacity and the national standard that prevailed in the two years prior (50%), three years prior (25%) and four years prior (25%). Thus, a shock with a persisting impact will only begin to have an impact on the calculations after two years and it is only after four years that the full impact of the shock will be reflected in these calculations.
Falling oil prices since mid-2014 will only begin to have an impact on the calculations in fiscal 2016-17. Therefore, the impact on equalization payments of the sharp drop in prices that occurred in 2015 will be more perceptible next year (2017) and will be fully reflected only in 2019.
The impact will be felt twofold. Firstly, since the Canadian nominal growth rate is lower, the overall equalization envelope will grow less rapidly. Next, the drop in the price of crude has reduced the fiscal capacity of the producing provinces and the shift in regional economic dynamism, currently favouring the center of the country, modifies the wealth gap between all provinces.
Two predictable changes should eventually follow. If the relative tendency remains, Ontario, which will receive equalization payments of $2.304 billion ($166 per capita) in 2016-17, should become once again a “rich” province. Its share of the total envelope will continue to shrink and it should cease to receive equalization payments possibly in 2019-20. As for Newfoundland and Labrador, who did not receive equalization payments since 2008-09 due to the new prosperity brought about by oil production, will once again become a receiving province. Although Alberta is highly impacted by the fall of oil prices, its relative wealth remains much higher than the national standard. Thus, it is highly unlikely that its status of non-receiving province will change in the foreseeable future. The same goes for Saskatchewan whose relative wealth – though not as high as Alberta’s – remains nonetheless way above the national standard. As for British Columbia, its gap above the national standard is lower but its recent and projected trend is rising. The provinces that will remain recipients (Prince Edward Island, Nova Scotia, New Brunswick, Quebec, Manitoba and soon Newfoundland and Labrador) should gradually see their share of the envelope increase as Ontario’s diminishes and disappears. On net, the recipients, except for Ontario, will presumably receive more equalization than otherwise.
Debt Ratings and Debt Ratios
In the past few months, debt rating agencies were closely monitoring provincial public finances. Since the budgets were tabled last year, there were no less than seven downgrades, the most noteworthy being Alberta and Newfoundland and Labrador. Dominion Bond Rating Service (DBRS), Moody’s and Standard & Poor’s (S&P) have maintained a negative outlook on Newfoundland and Labrador’s credit rating given that this province’s accumulated net debt of $14 billion will soon reach 50% of its GDP – twice the level it was three years ago. The provincial government has also pushed back the date of a return to a balanced budget to fiscal 2021-22. Despite increases in all levels of taxation, this government is anxiously hoping for an increase in oil prices to find its way out of this hole.
The new Alberta government recently withdrew the legislated ceiling of a 15% debt to GDP ratio that was put in place only last fall. Although the province’s debt ratio remains enviable, the postponement of a return to a balanced budget, possibly to 2024 rather than 2019 as previously forecast as well as a substantial forthcoming debt issuance programme were determining factors in the deterioration of this profile. These forecasts are based on average oil prices of $42 this year, $54 in 2017 and $64 in 2018.
Ontario and New Brunswick are expected to soon reach the critical debt ratio of 40%. This peak may well be reached this year in Ontario. Last summer, S&P, the rating agency, which for some time had raised a red flag on the province’s debt situation, finally downgraded its rating one notch to A+. New Brunswick will likely reach a debt ratio of 40% in 2018, which will probably decrease thereafter. Moody’s is the only agency that still rates New Brunswick’s credit at Aa while the other credit rating agencies have assigned ratings of A+ (S&P) and A (high) (DBRS).
Budget Overview
Quebec has now lost its title of the province with the highest debt level to Newfoundland and Labrador. Year in and year out, Quebec’s budget surpluses will be used to reduce its debt load and as such, the rating agencies hold a favourable view on the Generations Fund and the caution shown with the contingency fund.
The Impact of Crude Prices
If oil prices remain near recent levels (it has averaged $44 over the past 12 months), the outlook will be bleaker than what can be drawn so far from the recent budgets which were assuming higher prices from 2017 onwards. Governments could then be faced with a reduced fiscal capacity, especially those in the oil producing provinces.
Oil Price
Even if oil price forecasts from the governments of Alberta and Newfoundland and Labrador are accurate, the road to balanced budgets will be long and arduous. Equalization payments could provide some breathing room to Newfoundland and Labrador but Alberta still won’t be receiving revenues from that programme, which will also be the case for Saskatchewan and British Columbia.
Quebec’s budget could remain balanced but both the assumptions relating to equalization and its impact remain unclear at this time. As for Ontario, its public finances, soon to be balanced, face the challenge of remaining so given the likelihood that the province will stop being a recipient of equalization. More generally, all provincial governments are facing the challenge thrown at them by aging demographics (see Provincial Public Finances: Facing a Harsh Reality, May 2014) and, without financial aid from the federal government through exceptional support measures, will struggle to balance the books.
1We refer to financial repression when income generated by savings is lower than the rate of inflation. This happens particularly when central bank monetary policy keeps interest rates at lower levels than the rate would be in the free open market without such central banks’ interventions.
2Lukasz Rachel and Thomas D Smith, Bank of England, Staff Working Paper No. 571, Secular drivers of the global real interest rate, December 2015, 63 pages http://www.bankofengland.co.uk/research/Pages/workingpapers/2015/swp571.aspx
3See the Bank of Canada study on the causes of the slowdown in global trade at http://www.bankofcanada.ca/wp-content/ uploads/2015/05/boc-review-spring15-francis.pdf